
Raúl Gracia and Flavio Junqueira
Introduction
Streaming applications commonly ingest data from a wide range of elements – e.g., sensors, users, servers – concurrently to form a single stream of events. Using a single stream to capture the parallel data flows generated by multiple such elements enables applications to better reason about data and even process it more effectively. Ingesting data from a fleet of sensors onto a single stream, for example, allows an application to analyze all such sensor data by referencing that single stream. Enabling a high degree of parallelism for individual streams gives the application a choice to map its own abstractions to streams in such scenarios rather than dictated by artificial infrastructure limits.
Parallelism is also relevant when processing streaming data. When applications analyze streaming data, they often rely on parallel processing for both latency and throughput. To enable parallelism when reading streaming data, streaming storage systems allow the partitioning of the event workload upon ingestion, typically based on routing keys, to preserve ordering according to application concepts, such as identifiers. Each partition organizes data sequentially. In Pravega, the parallel unit of a stream is a segment, while in topic-based systems such as Apache Kafka and Apache Pulsar, they are called partitions. Pravega streams can dynamically scale the number of segments according to workload variations.
We focus in this post on the performance evaluation of Pravega in the presence of multiple writers appending to streams with many segments. We are interested in the append path, which is critical for ingesting streaming data effectively. We have analyzed basic IO functionality using a single writer and up to 16 segments in a previous post. Here, we use highly parallel workloads, with up to 100 writers and 5000 segments per stream. Our choice is motivated by requirements of modern cloud-native applications, such as the ability to scale out and sustain high performance for highly parallel workloads. We compare Pravega with both Kafka and Pulsar to understand the implications of different design choices these systems have made. The two key takeaways from our investigation are:
- Under a chosen workload of 250MBps with up to 100 writers and 5000 segments, Pravega can sustain 250MBps in all cases, whereas Kafka sustains less than 100MBps for 5000 partitions. Pulsar crashes in most cases for the same workload.
- Pravega can maintain the p95 latency below 10ms, whereas Kafka hits tens of milliseconds. For Pulsar, it presents single-digit latency for the one case that we were able to run successfully.
For fairness, we have tested other Pulsar configurations to understand under which conditions it presents good performance results. Consequently, we additionally present results with an alternative configuration that is more favorable for Pulsar and does not cause it to crash as often. This configuration, as we explain further below, is less challenging for the tested system.
In the sections below, we explain what makes Pravega better in such scenarios and detail our setup, experiments and results.
Why Pravega excels
Here we describe a few points about the Pravega append path that are important to understand the results. We also discuss a few trade-offs concerning design and state our choices for Pravega.
The Pravega append path
The append path in Pravega has three relevant parts:
- The client that appends data.
- The segment store that receives append requests and logs appends to make them durable.
- The durable log, implemented with Apache BookKeeper that guarantees durability.
The figure below illustrates the append path:
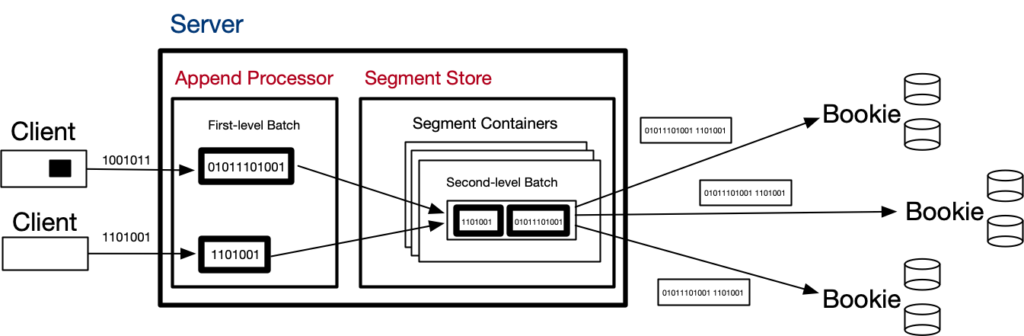
Clients append the data generated by application sources, and they batch such data to the extent possible. Client batches are collected on the server-side, to avoid buffering data, but the client controls when batches start and end. It uses a batch tracking heuristic to estimate batch sizes using input rate and feedback from the responses. With such estimates, the client determines when to close batches (in the code, AppendBatchSizeTrackerImpl.java).
As the size of client batches ultimately depends on how much data the application source can produce, it is possible that a single client is not able to make large enough batches on its own. Consequently, when multiple writers are available, we have the opportunity to aggregate the batches coming from multiple clients to form larger batches. That’s, in fact, one of the key roles of the segment store: to aggregate append data prior to writing it to the durable log.
The segment store performs this second level of batching in a component called the segment container. A segment store can run multiple segment containers concurrently, and each container has its own durable log open and appends to its log. Segment containers enable append parallelism in a single segment store instance.
Each segment container is responsible for the operations of a subset of segments across all streams in a Pravega cluster. Globally, the cluster coordinates the assignment of segment containers to segment store instances. When segment store instances are added (e.g., when scaling the system up) or removed (e.g., when scaling down or in the presence of crashes), the set of segment containers is rebalanced across the existing segment store instances.
The durable logs are currently implemented with Apache BookKeeper ledgers. A bookie, which is the BookKeeper storage server, journals requests to append data to a ledger, and it performs another level of aggregation before appending to its journal. This third level of aggregation is another opportunity to batch data coming from different segment containers. In the configuration we use for Pravega, a bookie only responds to the segment container once it has flushed the data to the journal to guarantee durability. BookKeeper also maintains other data structures, but they are not relevant to the discussion in this post.
Low Latency, High Throughput, and Durability
Low latency is vital for many streaming applications. Such applications require that data is available for processing soon after it has been produced. High throughput is equally desirable for applications ingesting large amounts of data, perhaps from many sources. Without a system that can sustain high throughput for ingestion, the application risks applying load shedding under spikes. Finally, missing data can induce incorrect results when analyzing a stream, and consequently, durability is critical for enterprise applications.
Achieving all three of these properties is challenging. Storage devices typically provide higher throughput with larger writes, forcing the system to accumulate data for longer and sacrifice latency. If the system favors latency, it accumulates less data per storage write and negatively impacts throughput. Of course, we can forget about this trade-off between latency and throughput if we do not flush data to disk before acknowledgement, but that choice sacrifices durability.
From all the three systems that we have evaluated, Pravega is the one that provides the best results overall concerning these three aspects. It guarantees durability while sustaining high throughput and low latency compared to Kafka and Pulsar for the configurations considered here. By default, Kafka makes a different choice for the three aspects. It can obtain higher throughput and lower latency in some configurations compared to the other two because it does not flush to disk, but that choice sacrifices durability. Pulsar enables the same durability as Pravega because it builds on BookKeeper; still, it does not seem to implement a write path that is efficient in the presence of many producers and partitions as the results are lacking compared to the other two systems.
Evaluation and Setup Summary
We have run our experiments on AWS. The methodology we use for Pravega is very close to what we described in our previous blog post; we refer to that post for more detail. One difference with our previous post is that, similar to what we do for Kafka, now for Pulsar we used the OpenMessaging Benchmark fork of StreamNative exercised in previous blog posts. In the following, we provide the main configuration settings for the experiments of this blog post:
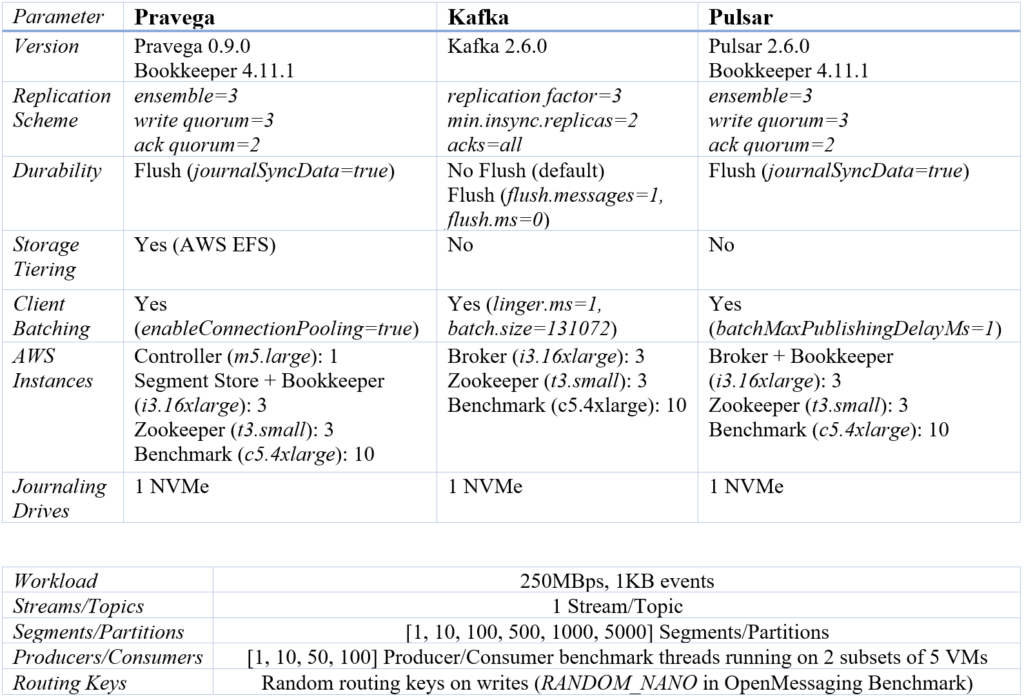
As in our previous post, we use the same replication scheme for Pravega, Apache Pulsar, and Apache Kafka: 3 replicas, 2 acknowledgements per write. For data durability, both Pravega and Pulsar guarantee data durability per write by default, and we preserve this behavior. For Kafka, we test two configurations: i) the default configuration, in which data is not explicitly flushed to the drive, and data loss can happen under correlated failures; ii) the flush configuration, which guarantees data durability by flushing data to the drive on a per-write basis. Journaling writes in all the systems use one NVMe drive, so we can understand how they make use of it as parallelism increases.
The instances we deploy are different compared to our previous post. Our experiments here use larger instances for the server (i3.16xlarge instances for Brokers and Segment Stores). The reason for changing the instances is that we observed all the systems using more CPU with many partitions/segments, and opted for increasing the CPU resources so that these systems are not bottlenecked by CPU. We also use multiple benchmark VMs. This deployment matches our goal to test these systems under high load by emulating a distributed, parallel data source (terraform config files available for Pravega, Kafka and Pulsar). Note also that Pravega is the only system offloading data to long term storage in this evaluation (AWS EFS).
We use the OpenMessaging Benchmark to run our experiments (see the full deployment instructions here and use this release). We chose to fix an ingest workload rate of 250MBps (1KB events) rather than explore and evaluate the maximum throughput. Our goal is to show how the different systems we compare behave when varying the number of clients and segments/partitions, and we have opted to keep the input workload fixed and not have yet another knob. We still discuss maximum throughput at the end of the post for completeness.
We configure our experiments to run OpenMessaging Benchmark producer and consumer threads distributed across the benchmark VMs (see the Producers/Consumers row in the table above). Each of the producer and consumer threads uses a dedicated Kafka, Pulsar, or Pravega client instance. Benchmark producer threads use producers (Kafka and Pulsar) or writers (Pravega), while benchmark consumer threads use consumers (Kafka and Pulsar) or readers (Pravega). Throughout the following sections, we use producers and consumers referring to the benchmark producers and consumers.
In the specific case of Pravega, the writer uses connection pooling: a feature that allows applications to use a common pool of network connections (10 connections per segment store by default) to manage large numbers of segments.
Data Ingestion and Parallelism
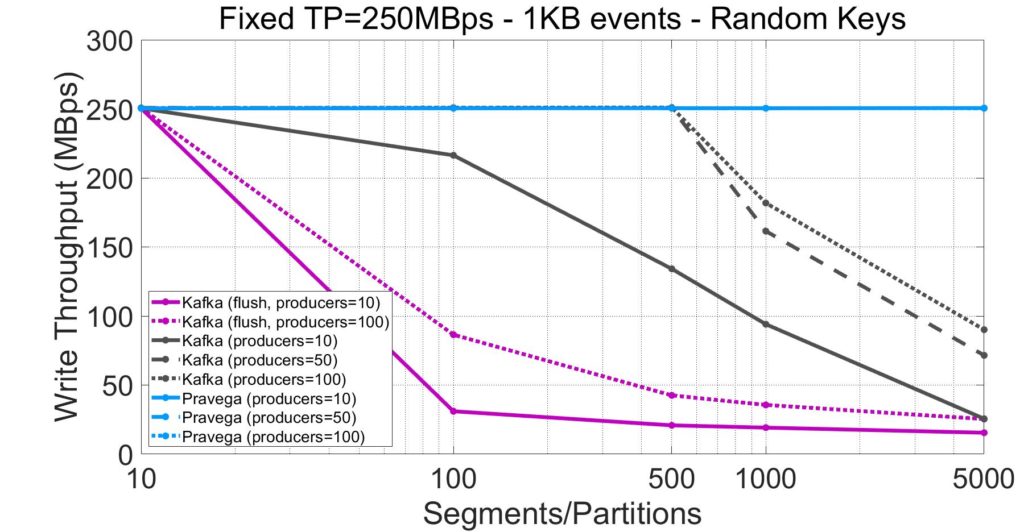
The first aspect we want to evaluate is the impact on throughput as a result of increasing the number of segments and clients. The plots below show throughput for Pravega, Kafka, and Pulsar with a varying number of stream segments and producers. Each line corresponds to a workload with a different number of producers appending to a single stream/topic. For Kafka and Pulsar, we also plot lines for alternative configurations that give more favorable results to those systems, at the cost of functionality.
This experiment can be reproduced via P3 Test Driver using as input the following workload and configuration files for Pravega (workload, config), Kafka (workload, config) and Pulsar (workload, config). The raw benchmark output for these systems is available here: Pravega, Kafka (no flush), Kafka (flush), Pulsar, Pulsar (favorable configuration).
By inspecting the plots above, we observe the following about the behavior of throughput as a function of parallelism:
- Pravega is the only system able to sustain the target throughput rate of 250MBps for streams with up to 5,000 segments in a stream and 100 producers. It suggests that the design of the append path of Pravega, and specifically, the batching of small appends from many writers at segment containers, is efficiently handling workload parallelism.
- The Kafka throughput drops as we increase the number of topic partitions. Adding producers for Kafka yields higher throughput up to a limit. There is a significant difference between 10 and 50 producers, while between 50 and 100 producers, the throughput difference for Kafka is marginal. This result confirms a common concern from users that Kafka’s performance deteriorates with the number of topic partitions.
- Appreciably, when we enforce durability in Kafka (“flush”), throughput is much lower (e.g., -80% for 100 producers and 500 partitions). While some penalty is expected from flushing messages to the drive, this experiment shows that enforcing durability for more than ten topic partitions penalizes throughput significantly.
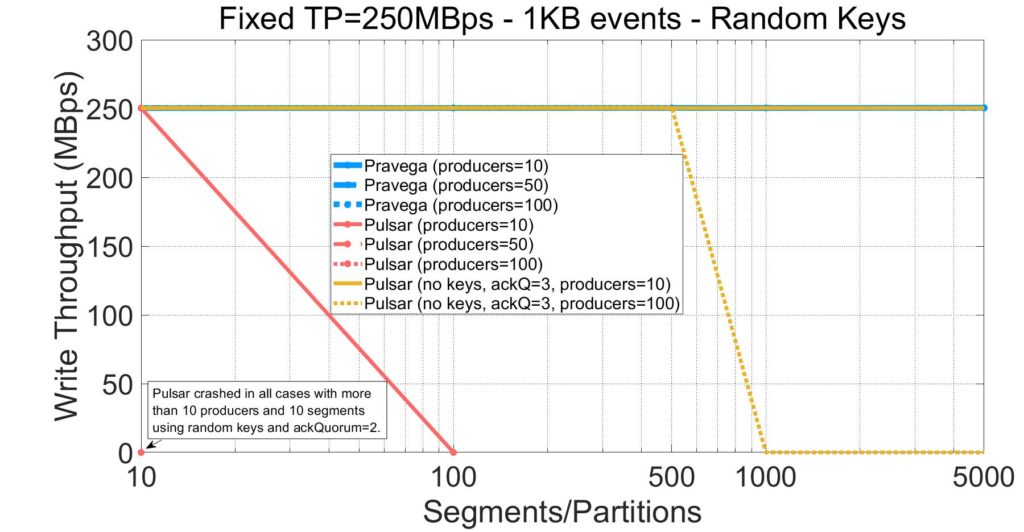
Pulsar crashed in most configurations we have experimented with. To understand the root cause of Pulsar’s stability problems, we tried with a more favorable configuration that:
- Waits for all acknowledgements from Bookies to prevent out-of-memory errors (see this issue for more detail).
- Does not use routing keys to write events (i.e., sacrifices event ordering and reduces the actual parallelism on writes). Without this configuration change, we observed errors in the Pulsar broker related to the Bookkeeper DBLedgerStorage not being able to keep up with writes.
With this configuration, Pulsar can get better results compared to the base scenario (e.g., 10 producers). However, it is still showing degraded performance and eventual instability when the experiment reaches a high number of producers and partitions. Note that not using routing keys on writes is the main contributor to Pulsar’s improvement. Internally, the Pulsar client optimizes the case without keys by creating larger batches and using segments in a round-robin fashion (see documentation).
In summary, both Kafka and Pulsar exhibit significant performance degradation when increasing the number of partitions and producers. Applications that require a high degree of parallelism might either be unable to satisfy performance requirements or have to throw more resources at the problem. Pravega is the only system that achieves consistent throughput for the number of producers and segments tested, while guaranteeing data durability with the given configuration.
Looking at Write Latency
Latency is equally if not more relevant than throughput when ingesting streaming data. Next, we show the write latency (95th percentile) as a function of the number of segments and producers. As an important note, in this section we present latency values for all systems irrespective of whether they sustain the target throughput.
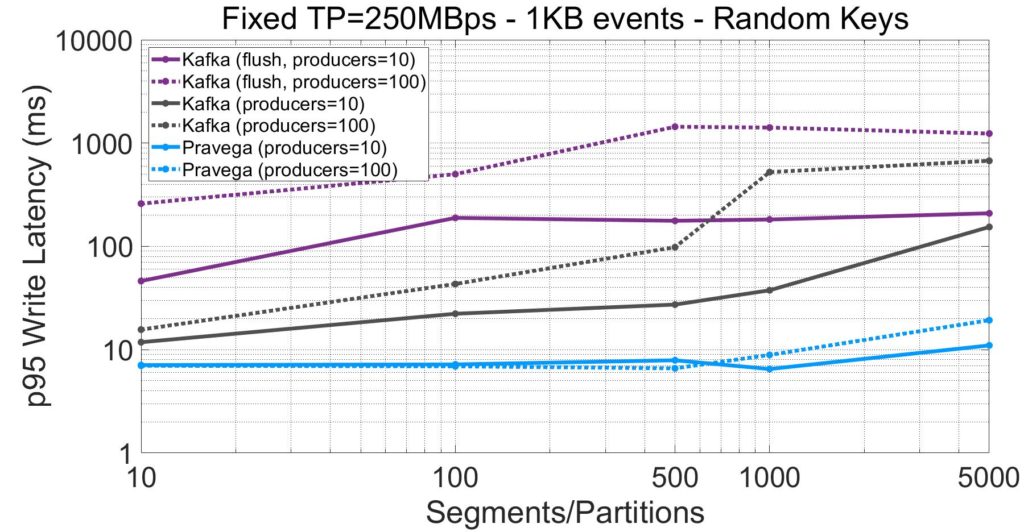
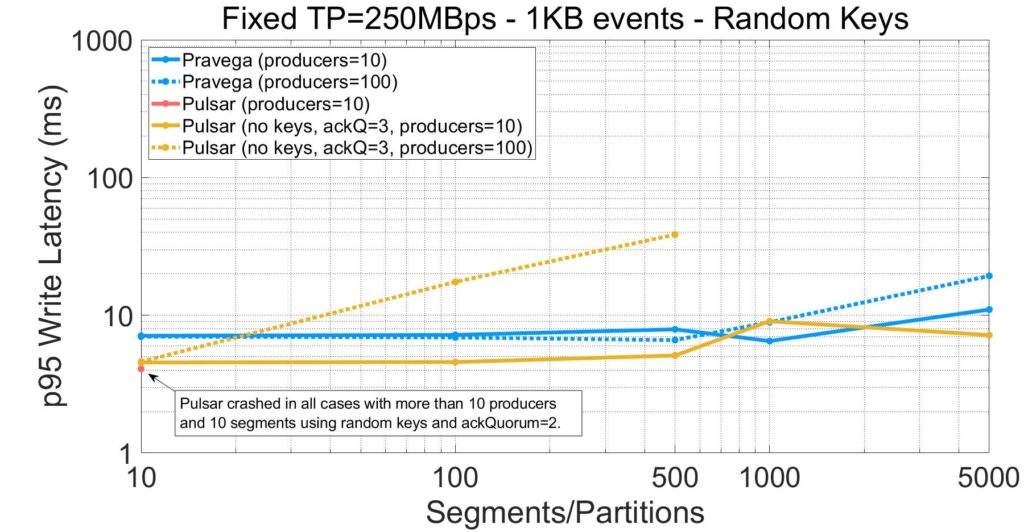
From the plots above, we highlight the following:
- Pravega provides single-digit p95 millisecond latency, whereas Kafka, even for its default configuration that does not flush to disk, shows much higher latencies. Recall from the last section that Pravega sustains the target throughput from many segments and producers, while Kafka does not.
- For 5000 segments, Pravega obtains lower latency for 10 producers compared to the 100-producer case. This effect is due to the batching. With more producers, the append path of Pravega makes the individual batches of producers smaller, which leads to more computation effort and queuing at the server side.
- The latency in Kafka when enabling data durability (“flush” mode) is much higher compared to the default configuration (e.g., 13.6x higher latency at p95 for 100 producers and 500 segments). In the presence of high parallelism, applications might need to choose between performance and durability.
- Pulsar with the base configuration provides low latency results only for the 10-segment case (10 producers). Any experiment for a larger number of segments and clients leads to system instability.
- When using a more favorable configuration, Pulsar obtains single-digit millisecond latency for the 10-producer case. With 100 producers, latency quickly climbs up with the number of segments.
Compared to Kafka, Pravega obtains much lower latency, even for the default Kafka configuration that does not flush data to drive upon acknowledgement. For Pulsar, system instability did not allow us to perform a clean comparison for the configuration we established. With a more favorable configuration, we obtained mixed results as Pulsar provides single-digit millisecond latency for 10 producers, but the latency quickly climbs up for 100 producers.
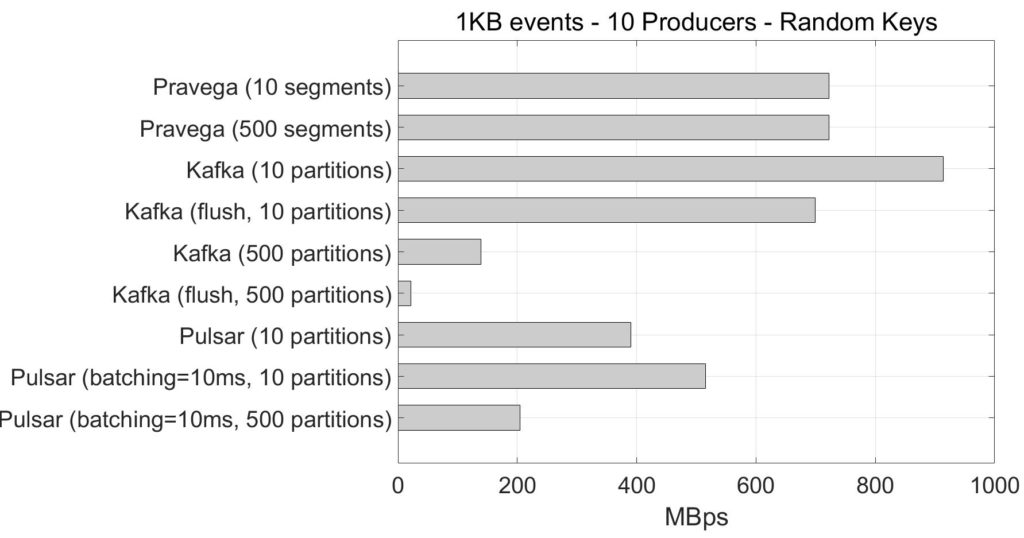
A note on maximum throughput
While we have used a fixed target rate in our experiments above, we also want to understand the maximum throughput that these systems can achieve in our scenario. To narrow down the analysis, we pick 10 and 500 segments/partitions to contrast (10 producers).
The raw benchmark output for these experiments is available here.
Pravega can get a maximum throughput of 720MBps from the benchmark perspective for both 10 and 500 segments, translating into roughly 780MBps at the drive level. The difference is due to the metadata overhead added by Pravega (e.g., segment attributes) and BookKeeper. This is very close to the maximum throughput we can get with synchronous writes on the drives used:
[ec2-user@ip-10-0-0-100 ~]$ sudo dd if=/dev/zero of=/mnt/journal/test-500K bs=500K count=100000 oflag=direct
100000+0 records in
100000+0 records out
51200000000 bytes (51 GB) copied, 63.7856 s, 803 MB/s
For Pulsar with the defined configuration, we can reliably get almost 400MBps of throughput at the benchmark level. We have also explored increasing the client batching time to 10ms, which translates into a moderate improvement in throughput (515MBps). Still, we observe that this is far from the maximum capacity of drives, and we suspect that it is due to the use of routing keys, as it reduces the batching opportunities for Pulsar clients. Even worse, we also see that the Pulsar throughput is significantly limited as we increase the number of partitions. This result suggests that relying mainly on the client for aggregating data has important limitations.
For the 10-segment case, we observe that when Kafka guarantees durability (“flush” mode), it can achieve up to 700MBps and 900MBps, when writes are acknowledge and not acknowledged, respectively. Note that this only happens for the 10-segment case, as for 500 segments the throughput drops to 22MBps and 140MBps, respectively.
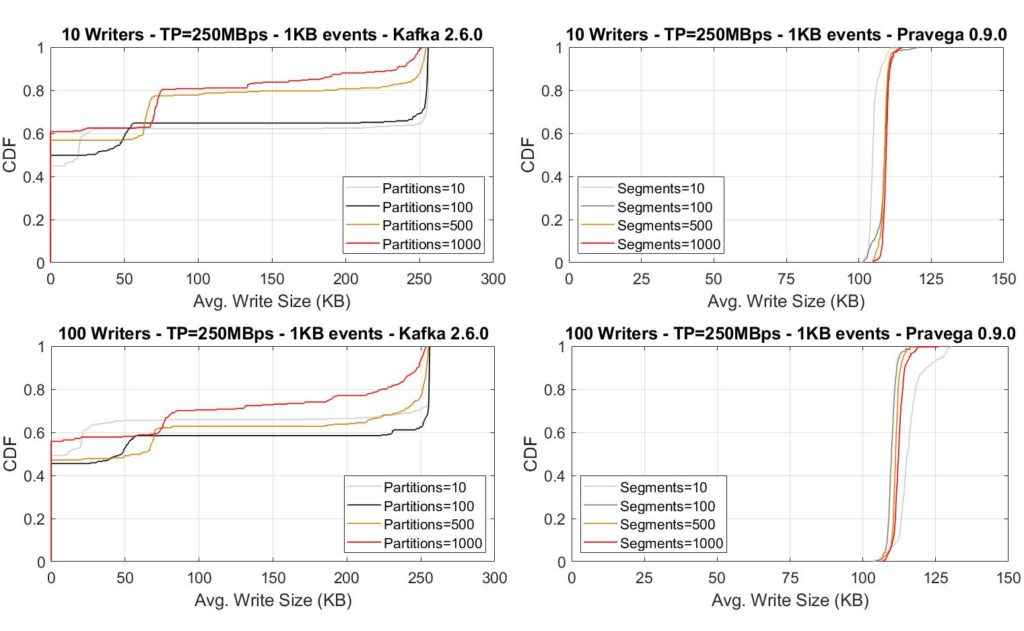
For more depth, we have instrumented the server-side instances with iostat while executing several experiments. According to the information collected from iostat, every second, not flushing data in Kafka allows the OS to buffer much larger writes to the drive, leading to higher throughput. The plots below show the translation of such behavior for Kafka writes from the OS perspective: writes tend to be 250KB in size, or there are no writes at all due to buffering (size 0). Conversely, Pravega shows a smaller but consistent write size, given that each write is flushed to the drive, and the Pravega append path defines their size. Note that even when sacrificing durability, Kafka can only achieve such throughput rate for fewer partitions.
Conclusion
As more use cases arise requiring stream parallelism for both reading and writing, it becomes critical that stream storage accommodates such workloads efficiently and effectively. Many such applications are cloud-native and require the ability to scale out and parallelize workloads efficiently.
This post shows that Pravega can sustain high throughput for thousands of segments and tens of concurrent writers while maintaining low latency and guaranteeing data durability. Providing high throughput, low latency, and data durability simultaneously is a challenging problem. The messaging systems we compared against, Kafka and Pulsar, fell short for the same set of resources. The append path of Pravega, which includes multiple batching steps, enabled higher performance while guaranteeing data durability for challenging workloads that require a high degree of parallelism. More performance evaluation results to come in future posts. Stay tuned.
Acknowledgements
This blog post is yet another result of team effort. From all the people involved, we especially thank Andrei Paduroiu and Tom Kaitchuck for their support with the analysis and the performance improvements, and Srikanth Satya for critical insights on the results. We thank Ashish Batwara for making all necessary resources available and for comments that helped to shape the post. We acknowledge Pavel Lipsky, Oleg Kashtanov and Tim Butler for all the support with experiments and analysis.
About the Authors

Raúl Gracia is a Principal Engineer at DellEMC and part of the Pravega development team. He holds a M.Sc. in Computer Engineering and Security (2011) and a Ph.D. in Computer Engineering (2015) from Universitat Rovira i Virgili (Tarragona, Spain). During his PhD, Raúl has been an intern at IBM Research (Haifa, Israel) and Tel-Aviv University. Raúl is a researcher interested in distributed systems, cloud storage, data analytics and software engineering, with more than 20 papers published in international conferences and journals.
Flavio Junqueira is a Senior Distinguished Engineer at Dell. He holds a PhD  in computer science from the University of California, San Diego, and he is interested in various aspects of distributed systems, including distributed algorithms, concurrency, and scalability. His recent work at Dell focuses on stream analytics, and specifically, on the development of Pravega. Before Dell, Flavio held an engineering position with Confluent and research positions with Yahoo! Research and Microsoft Research. Flavio has co-authored a number of scientific publications (over 5,000 citations according to Google Scholar) and an O’Reilly ZooKeeper book on Apache ZooKeeper. Flavio is an Apache Member and has contributed to projects hosted by the ASF, including Apache ZooKeeper (as PMC and committer), Apache BookKeeper (as PMC and committer), and Apache Kafka.