
Introduction
Today there are billions of sensors around the world, producing a massive amount of data. Some sensor data will be used only at the edge, and some will be sent to the cloud or data centers for aggregation, analytics, and AI efforts. These sensors may measure or produce images, video, lidar, audio, acceleration, GPS, temperature, humidity, pressure, IP network traffic, CPU usage, and more. The solution presented in this blog post provides a single framework that can be used to capture, transport, aggregate, correlate, analyze, visualize, and perform real-time inference on a wide variety of sensor data, at the edge and in the cloud.
A goal for this blog post is to allow anybody to begin using Pravega and related open-source applications to build a working end-to-end solution on their PC. Since not everyone has access to accelerometers or other external sensors, we’ll use your network interface card (NIC) byte counters, which are available on any Linux system. Although your production use case will use different types of sensors, the tools, and techniques used to collect, transport, store, and analyze the data are very similar. While this blog post shows you how to run this pipeline on a PC for learning, experimenting, and prototyping, you can run the same software in Dell EMC Streaming Data Platform (SDP) for a production enterprise-class solution.
Overview of the Solution
The following diagram shows the main components of this solution. The arrows indicate the direction of the primary data flow. To simplify the diagram, we are only showing one server for each location. For high availability and scalability in a production environment, we need at least three servers.
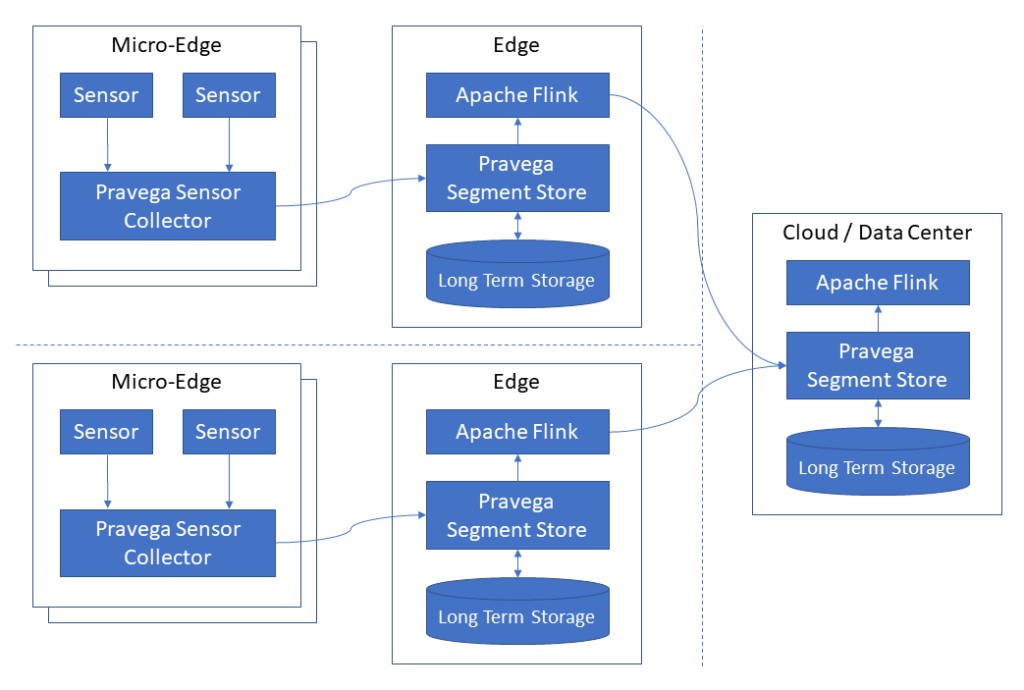
- Micro-edge (a.k.a. edge gateway): The micro-edge is a general-purpose computer closest to the sensors. This is typically a small computer with 4 GB of RAM, an x86 64-bit CPU, and a Linux operating system. SSD storage can be utilized for storing sensor data until it can be sent to the edge.
- Sensors: A variety of sensors can be utilized, including accelerometers and network interface card (NIC) counters.
- Pravega Sensor Collector: Pravega Sensor Collector is an application that runs on a micro-edge computer. It continuously reads data from directly connected sensors and writes the data to a Pravega stream at the edge.
- Edge: The edge is a small computer cluster that aggregates data from multiple micro-edge devices. In a highly available configuration, three or more servers form a Kubernetes cluster, and a distributed file system or object store is used to store Pravega streams. A single server can be used if high availability is not required. Many micro-edge computers connect to a single edge cluster.
- Pravega: Pravega provides a new storage abstraction – a stream – for continuous and unbounded data. A Pravega stream is a durable, elastic, append-only, unbounded sequence of bytes with good performance and strong consistency. Pravega is cloud-native and open-source.
- Long-term storage: Pravega uses two-tier storage to provide low-latency durable writes and cost-efficient long-term storage to serve historical reads. In a highly-available configuration, long-term storage must be a distributed file system such as HDFS, Dell EMC PowerScale, or Dell EMC ECS.
- Apache Flink: Apache Flink® is an open-source stream processing framework for distributed, high-performing, always-available, and accurate data streaming applications. In this blog post, we use a Flink streaming job to copy stream events from the edge to the cloud continuously. We also use a Flink streaming job to transform the raw sensor data and export it to CSV files for visualization with commonly used tools. Although not explored in this blog post, Flink is also widely used to continuously read data streams from Pravega, correlate the streams, and apply an inference model.
- Cloud / Data Center: As an optional part of this solution, in the cloud or an on-premises data center, we collect and process a subset of the stream data collected at the edge. We can run the same software stack in the edge and in a data center. Alternatively, if stream processing is not needed in the cloud, we only need storage such as S3, HDFS, or NFS.
Pravega Sensor Collector
Pravega Sensor Collector can continuously collect high-resolution samples without interruption, even if the network connection to the Pravega server is unavailable for long periods. For instance, there may be long periods between cities where there is no network access in a connected train use case. During this time, the Pravega Sensor Collector stores collected sensor data on a local disk and periodically attempts to reconnect to the Pravega server. It stores this sensor data in local SQLite database files. When transferring samples from a SQLite database file to Pravega, it coordinates a SQLite transaction and a Pravega transaction in a two-phase commit protocol, described in detail in the Recovery from Failures section below. This technique allows it to guarantee that all samples are sent in-order, without gaps, and without duplicates, even in the presence of computer, network, and power failures (i.e. exactly-once consistency). To learn more about exactly-once consistency, refer to the blog here.
Pravega Sensor Collector is designed to collect samples at a rate of up to 1000 samples per second (1 kHz) or even higher depending on the sensor. This makes it possible, for instance, to measure high-frequency vibrations from accelerometers. It batches multiple samples into larger events that are periodically sent to Pravega. The batch size is configurable to allow you to tune the trade-off between latency and throughput that is appropriate for your use case. For the demonstration in this blog post, we’ll use a sample rate of 1000 samples per second and a batch size of 1000 samples per event, leading to one event per second.
Pravega Sensor Collector is a Java application. It has a plug-in architecture to allow Java developers to easily add drivers for different types of sensors or transform the sensor data in different ways. It currently provides drivers for the following devices:
- ST Micro lng2dm 3-axis Femto accelerometer, directly connected via I2C
- Linux network interface card (NIC) statistics (byte counters, packet counters, error counters, etc.)
- Generic CSV file import
Pravega
Pravega (“good speed” in Sanskrit) is an open-source storage system for streams built from the ground up to ingest data from continuous data sources and meet such streaming workloads’ stringent requirements. It provides the ability to store an unbounded amount of data per stream using tiered storage while being elastic, durable, and consistent. Both the write and read paths of Pravega have been designed to provide low latency along with high throughput for event streams in addition to features such as long-term retention and stream scaling. Pravega provides an append-only write path to multiple partitions (referred to as segments) concurrently. For reading, Pravega is optimized for both low latency sequential reads from the tail and high throughput sequential reads of historical data.
Pravega Flink Tools
Pravega Flink Tools is a collection of Apache Flink applications to process Pravega streams. For this solution, we will use the Stream-to-Stream application to continuously copy events from a Pravega stream in the edge to another Pravega stream in the cloud or data center. We’ll also use the Stream-to-CSV-File application to periodically write sensor data from a Pravega stream to a series of CSV files, which can be opened in commonly used tools such as Microsoft Excel.
Pravega Flink Tools provides the following Flink applications:
- Stream to File: Continuously copy a Pravega stream to text files on S3, HDFS, or any other Flink-supported file system
- Stream to Parquet File: Continuously copy a Pravega stream to Parquet files on S3, HDFS, or any other Flink-supported file system
- Stream to CSV File: Continuously copy a Pravega stream to CSV files on S3, HDFS, or any other Flink-supported file system
- Stream to Stream: Continuously copy a Pravega stream to another Pravega stream, even on a different Pravega cluster
- Stream to Console: Continuously show the contents of a Pravega stream in a human-readable log file
- Sample Data Generator: Continuously write synthetic data to Pravega for testing
Each application uses Flink checkpoints to provide exactly-once guarantees, ensuring that events are never missed nor duplicated. They automatically recover from failures and resume where they left off. They can use parallelism for high-volume streams with multiple segments.
Recovery from Failures
Many types of failures can occur in this solution. For example:
- Power failure of micro-edge
- Network failure between micro-edge and edge
- Power failure of one or more edge servers
- Network failure between edge servers
- Out-of-memory or other application errors at micro-edge
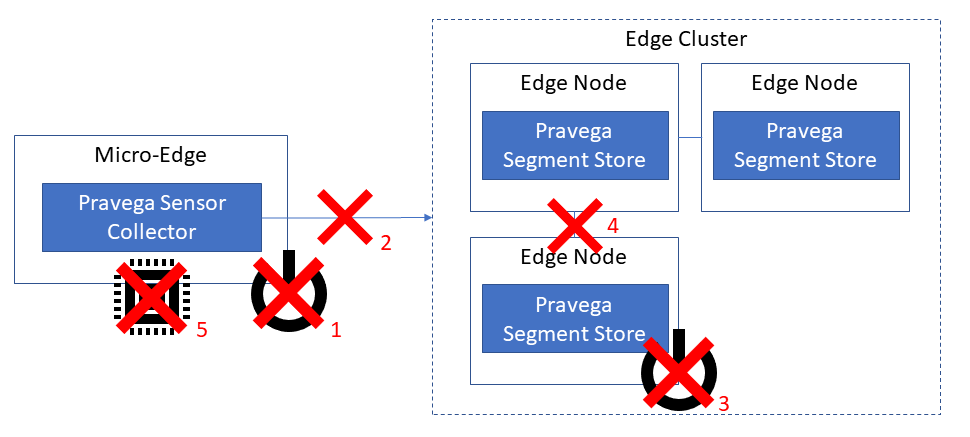
The highly-available design of Pravega and Kubernetes handle failure types 3 and 4. Automatic application startup and restart handle much of failure types 1, 2, and 5. However, we need to carefully investigate the communication between the Pravega Sensor Collector and the Pravega server, which uses the typical request-acknowledge pattern. The key aspects of the protocol are shown in the following sequence diagram.
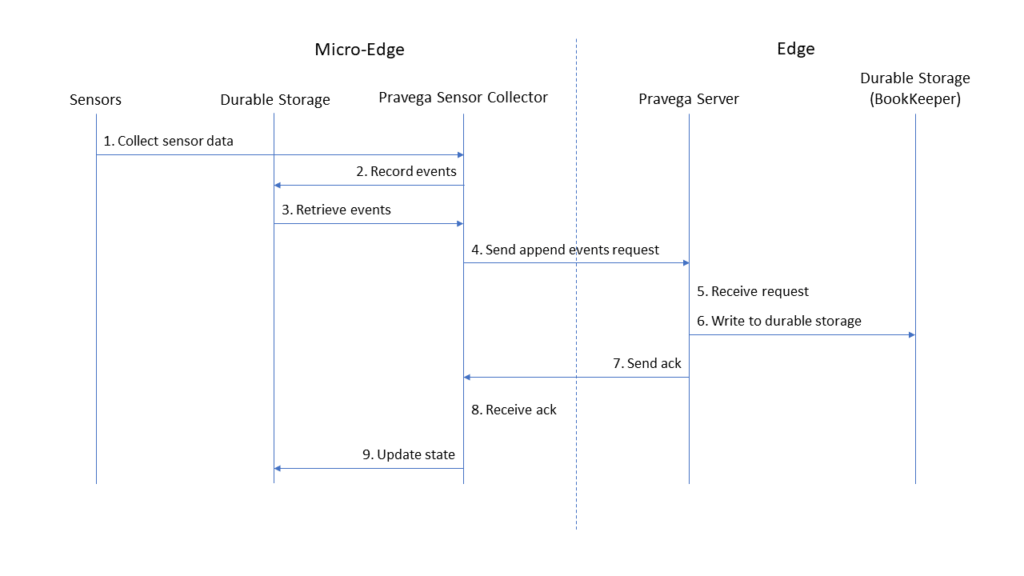
- The Pravega Sensor Collector at the micro-edge collects raw data from sensors.
- The Pravega Sensor Collector converts the raw sensor data into serialized events, written to its durable storage (a local SQLite database).
- The Pravega Sensor Collector reads a batch of events from its durable storage.
- The Pravega Sensor Collector sends a request to the Pravega server to append this batch of events to a stream.
- The Pravega server at the edge receives the request.
- The Pravega server processes the request by writing the events to durable storage (an Apache BookKeeper cluster).
- The Pravega server sends an acknowledgment to the Pravega Sensor Collector.
- The Pravega Sensor Collector receives the acknowledgment.
- The Pravega Sensor Collector updates its state by deleting the sent events from its durable storage.
A failure can occur at any point in this process. Let’s consider what would happen if the micro-edge suddenly loses power between steps 7 and 9. Although the events have been written to the Pravega stream, the Pravega Sensor Collector did not get the acknowledgment. A naïve implementation would simply resend the request to write events, causing the events to be written twice to the stream. For some use cases, the occasional presence of duplicate events can be tolerated. However, many analytics operations require such duplicates to be detected and eliminated through a process known as deduplication. There are various techniques to deduplicate data, but they generally suffer from high processing requirements and increased latency.
To provide recovery from such failures while maintaining exactly-once semantics, Pravega Sensor Collector uses Pravega transactions and a two-phase commit protocol to coordinate updates to Pravega and a local SQLite database. An invariant in this protocol is that the local SQLite database will always contain two consistent pieces of information:
- a list of zero or more Pravega transaction IDs that are flushed and ready to be committed
- an indication of the workload to process after these transactions have been committed – for example, this may be a table containing sensor data
After each batch of events has been processed, these two pieces of information are updated atomically in a SQL transaction. Following this, the Pravega transaction is committed. If the application fails for any reason at any point, it can be recovered simply by committing or recommitting these transactions. If you wish to learn more about this two-phase commit protocol, refer to TransactionCoordinator.java.
JSON and Serialization
The Pravega Event Stream API allows applications to write and read events consisting of arbitrary sequences of bytes of up to 8 MiB. The process of converting an in-memory object to a sequence of bytes that can be persisted is called serialization. JSON is among the most common and easy to use serialization formats. Nearly all data processing tools and languages have good built-in support for JSON. Additionally, JSON is easy for humans to read without any special tools. For these reasons, for this blog post, we’ll use JSON for events in Pravega. Of course, an application can choose to use any serialization format with Pravega, but we’ll leave this for a future blog post.
Running this system on your PC
To allow anybody to run this system on their PC for learning, experimenting, and prototyping without requiring accelerometers or other external sensors, we’ll use your network interface card (NIC) byte counters, which are available on any Linux system. Pravega Sensor Collector will be used to collect network interface byte counters at very high resolution (1000 times per second). This high resolution is not currently available in standard monitoring tools, which generally sample at 1 to 10 second intervals. We can then perform various activities (i.e., watch streaming video, download files) and measure the network usage during each one.
Installation Procedure
Install Prerequisites
Install Operating System
Install Ubuntu 20.04 LTS. Other operating systems can also be used but the commands shown below have only been tested on this version.
Although Pravega and Apache Flink can be developed on Windows, the NIC driver in Pravega Sensor Collector that we will be using for this blog only works on Linux. If you are using Windows, it is recommended to run Ubuntu in VMware Workstation Player, which is free for personal use. You may also use Windows Subsystem for Linux (WSL 2).
Install Java 11
We will run Pravega 0.9, which requires Java 11. Java can be installed with the command below.
sudo apt-get install openjdk-11-jdk
You may have multiple versions of Java installed. Ensure that Java 11 is the default with the command below.
sudo update-alternatives --config java
Run Pravega
This will run a standalone development instance of Pravega locally. It will store data only in memory, and the data will be lost when the process terminates. The transaction parameters allow transactions to remain open for up to 30 days without lease renewals.
cd
git clone https://github.com/pravega/pravega
cd pravega
git checkout r0.9
./gradlew startStandalone \
  -Dcontroller.transaction.lease.count.max=2592000000 \
  -Dcontroller.transaction.execution.timeBound.days=30
Run Pravega Sensor Collector
This will start Pravega Sensor Collector, configured to collect network interface statistics for a single NIC. It will collect 1 sample every one millisecond (1000 Hz). In the commands below, replace “eth0” with the name of the network interface you wish to monitor. You can view the list of available interfaces with “ip link.” Typical LAN interfaces are eth0, ens33, and ens160.
cd
git clone https://github.com/pravega/pravega-sensor-collector
cd pravega-sensor-collector
git checkout blog1
source pravega-sensor-collector/src/main/dist/conf/\
env-sample-network-standalone.sh
export PRAVEGA_SENSOR_COLLECTOR_NET1_NETWORK_INTERFACE=eth0
./gradlew run
You can find a description of the available configuration parameters in the file env-sample-network-standalone.sh.
While running Pravega Sensor Collector, perform various tasks that utilize the network, such as downloading a file or watching a video.
Run Stream to Console Flink Job
To view the data that is being written to the Pravega stream, we can use the Stream-to-Console Flink job.
cd
git clone https://github.com/pravega/flink-tools
cd flink-tools
git checkout blog1
./gradlew -PmainClass=io.pravega.flinktools.StreamToConsoleJob \
  flink-tools:run \
  --args="--input-stream examples/network \
  --input-startAtTail false"
When executed, this Flink job will print each event to the screen. Below is an abbreviated sample output, which shows three samples one millisecond apart. Note that Pravega Sensor Collector writes multiple samples as a single array of numbers, which is much more space-efficient than writing an array of JSON objects.
{"TimestampNanos":[1609363757807000000,1609363757808000000,1609363757809000000,…],
"RxBytes":[719763680,719763680,719763790,…],
"TxBytes":[4594274,4594294,4594294,…],
"RemoteAddr":"ubuntu","Interface":"ens33",
"LastTimestampFormatted":"2020-12-30T21:29:17.809Z"}
Run Stream to Stream Flink Job
We can use the Stream-to-Stream Flink job to continuously copy events from the Pravega stream at the edge to another Pravega stream, on the same Pravega cluster or another Pravega cluster. We’ll copy events to a different stream in the same local Pravega server in the example below. By changing the output-controller parameter, this job could easily write to a different Pravega cluster. When you have multiple streams, either in the same edge system or across many edge systems, you’ll run one instance of this job per stream. You can have parallelism while maintaining event ordering by using a different fixedRoutingKey parameter for each edge system.
This Flink job uses Flink checkpoints and Pravega transactions to provide exactly-once guarantees, ensuring that events are never missed, duplicated, or processed out of order. When configured appropriately, it will automatically recover from failures and resume exactly where it left off. It can also use parallelism for high-volume streams with multiple segments.
cd ~/flink-tools
./gradlew -PmainClass=io.pravega.flinktools.StreamToStreamJob \
  flink-tools:run \
  --args="\
  --input-stream examples/network \
  --input-startAtTail false \
  --output-stream examples/network-cloud \
  --output-controller tcp://127.0.0.1:9090 \
  --fixedRoutingKey edge1 \
  "
Run Stream to CSV File Flink Job
To explore small amounts of data, it may be convenient to export the data from Pravega to a comma-separated value (CSV) file. A Stream-to-CSV-File Flink job that creates a new CSV file every 10 seconds by default can be used for this purpose. However, when the input-startAtTail parameter is false, it will export all data in the stream, and the first few files may be huge. Once it has caught up to the current position in the stream, subsequent files will contain 10 seconds worth of samples.
CSV files are placed in a directory named similar to 2020-12-30–21 and files are named similar to part-0-9051. The content of a file looks like:
ubuntu,ens33,1609363757807000000,719763680,4594274
ubuntu,ens33,1609363757808000000,719763680,4594274
ubuntu,ens33,1609363757809000000,719763790,4594294
To convert JSON events into CSV rows, this particular Flink job uses an Apache Avro schema. Although this job does not use Avro serialization, it uses the Avro library to parse the input JSON, convert data types, and allow for schema evolution. Avro schemas a very simple to write. The schema we use is named NetworkSamples.avsc.
{
  "namespace": "io.pravega.flinktools.util",
  "type": "record",
  "name": "NetworkSamples",
  "fields": [
    {"name": "RemoteAddr", "type": "string"},
    {"name": "Interface", "type": "string"},
    {"name": "TimestampNanos",
     "type": {"type": "array", "items": "long"}},
    {"name": "RxBytes",
     "type": {"type": "array", "items": "long"}},
    {"name": "TxBytes",
     "type": {"type": "array", "items": "long"}}
  ]
}
To execute this Flink job, run the following command.
cd ~/flink-tools
./gradlew -PmainClass=io.pravega.flinktools.StreamToCsvFileJob \
  flink-tools:run \
  --args="\
  --input-stream examples/network \
  --input-startAtTail false \
  --output /tmp/network.csv \
  --avroSchemaFile ../test/NetworkSamples.avsc \
  --flatten true \
  --parallelism 1 \
  "
The output of this job, Stream-To-Parquet-File, and Stream-To-File can be placed on any Flink-supported file system, including S3, HDFS, and NFS. This functionality can be effectively utilized to copy the stream data to a file system or object store in the cloud or data center.
Visualizing Network Statistics
Next, open the file /tmp/network.csv/part-0-0 with Microsoft Excel or LibreOffice Calc. Insert a new row at the top with the column labels remoteAddr, interfaceName, timestampNanos, rxBytes, and txBytes. To make the data more readable, add the new calculated columns F and G, using the formulas shown below.

Finally, highlight columns F and G and create a scatter (XY) plot. Note that we want a scatter plot instead of a line (categorical) plot so that variations in the time between samples do not distort the chart.
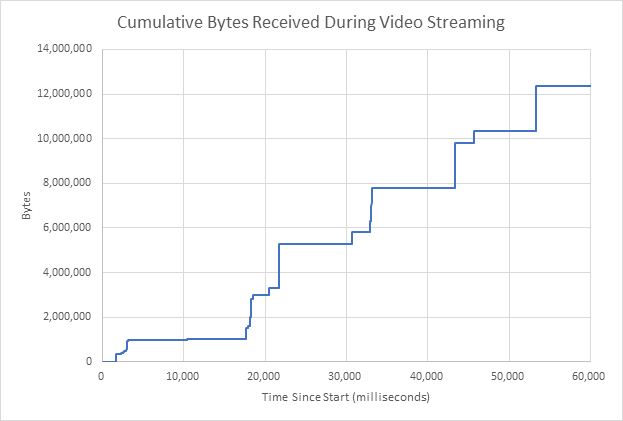
To provide an example, a network interface was monitored with Pravega Sensor Collector while using a web browser to watch a video for one minute. The resulting chart is shown below. The vertical lines represent network bursts, and the horizontal lines represent idle periods. The network bursts occur every 10 to 15 seconds. A total of 12 MB was received during this time.
For the next chart, a 220 MB file was downloaded in one minute. This curve is much smoother, and there are no visible idle periods.
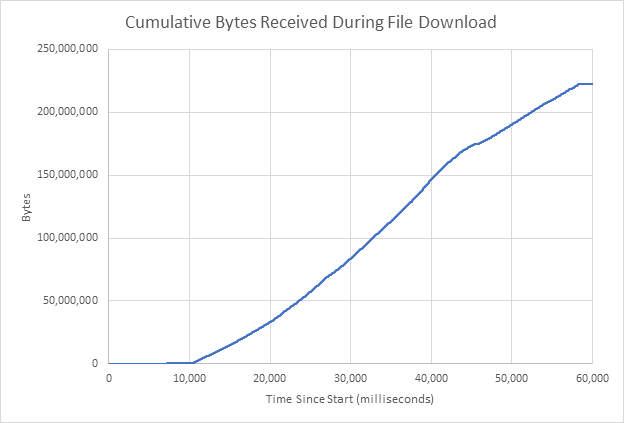
Although CSV files and Microsoft Excel are rarely used for real streaming use cases, nearly every new project starts with visualizing a small batch of data using simple file-based tools. We’ll see how we can use Apache Flink to perform true low-latency stream processing on Pravega streams in a future blog.
Considerations for Moving to Production
As shown in the previous section, you can run this entire system on a single PC with open-source software. This is great for learning to build and use the system. However, there are many aspects that you must consider when running this system in production.
- Long Term Storage – Pravega stores all stream data in a distributed reliable storage tier referred to as Long Term Storage (LTS). Pravega can use HDFS, NFS, Dell EMC PowerScale, or Dell EMC ECS for LTS.
- High Availability and Scalability – Many use cases have requirements for high availability (HA) and scalability. Pravega, Flink, and LTS are designed to be highly available and scalable.
- Security – A production system must consider many security aspects, including transport encryption (TLS), authentication, and authorization.
- Kubernetes – Many modern businesses embrace Kubernetes to manage their application deployments in the cloud, their data centers, and the edge.
- Pravega retention policies – By default, Pravega streams can grow forever as long as LTS has sufficient capacity. Pravega streams can also be configured to automatically delete the oldest events based on the age of events or the total bytes used.
Building a system described in this blog and the production considerations presented in this section is very complicated and time-consuming. Dell EMC Streaming Data Platform (SDP) is a fully supported software solution offered by Dell. This enterprise-ready, out-of-the-box software platform is built to support on-premises ecosystems with hardware supporting Kubernetes, which provides a powerful, scale-out high-availability platform. The offering is built on open source technologies – such as Apache Flink and Pravega – to enable access to an extensive array of capabilities and engines. In doing so, Streaming Data Platform creates a programming model that empowers the capabilities from multiple engines while also reducing application development time, giving your team more time to focus on ingenuity and the next level of business needs.
Conclusion
This blog has demonstrated how the Pravega ecosystem and Apache Flink can provide a single framework that can be used to capture, transport, aggregate, correlate, analyze, visualize, and perform real-time inference on a wide variety of sensor data, at the edge and in the cloud. This framework can be used as a fundamental component of any AI-powered solution that requires low latency and high throughput streaming storage, analytics, and transport.
About the Authors

Claudio Fahey is a Software Engineer for the Streaming Data Platform at Dell Technologies. He has designed a variety of stream processing solutions utilizing Pravega, Apache Flink, Apache Spark, TensorFlow, and GStreamer. He has also designed reference architectures for scalable deep learning systems using GPUs and enterprise storage systems. Prior to joining Dell EMC, Claudio spent eight years at Cinedigm, most recently as the VP of Architecture, where he focused on a variety of Digital Cinema initiatives, including live video, high-speed satellite delivery, and disk duplication. Claudio has a deep understanding of complex systems that include deep learning, big data, storage, databases, security, cryptography, software engineering, performance testing, and streaming video. Claudio has a bachelor’s degree from the University of California at Berkeley.

Ashish Batwara is a Director of Software Engineering, Streaming Data Platform at Dell Technologies. Streaming Data Platform is an analytic platform to ingest, store, and analyze real-time and historical streaming data. He is interested in distributed systems, storage, networking, cloud, edge computing, and analytics. He holds an MS in Electrical Engineering from the Indian Institute of Technology Delhi, India, an MBA from San Jose State University, and pursuing certification in Innovation and Entrepreneurship from Stanford graduate school of Business. He has ten granted patents and two storage industry proposals, which are now the industry standard.
